As the saying goes, ‘a picture is worth a thousand words’.
Pictures and videos are a powerful way to tell stories, communicate ideas, and create an emotional connection – which is why making your content visual is such a powerful marketing strategy.
The power of visual content makes it much more likely to be shared online, which means it’s a great way to get more visibility and traffic from your content marketing efforts.
Here are several ways to make your content more visual.
Turn Text Into Video
According to Cisco, global video traffic was 75 percent of all online traffic in 2017, and that number is expected to continue growing!
People LOVE to watch video! But does that mean you have to create a Hollywood production every time you want a new marketing video?
NO! In fact, it’s well-known amongst online direct marketing experts that simply transcribing a script and putting the words on the screen as a video is one of the most powerful sales and marketing tools in existence – referred to as a ‘video sales letter’.
And it’s not hard to do.
With a tool like Lumen5, you can simply enter the URL of any blog post and the service will turn it into a video, complete with images and music, in minutes!

This is one of the simplest and most powerful ways to turn your written content into a much more dynamic and marketable format!
Infographics
Infographics are one of the most popular content formats on the internet. According to a report by demandgenreport.com, having infographics can add 12% more traffic to a website.
And you don’t have to be a graphic artist to make one, as PiktoChart illustrates here:
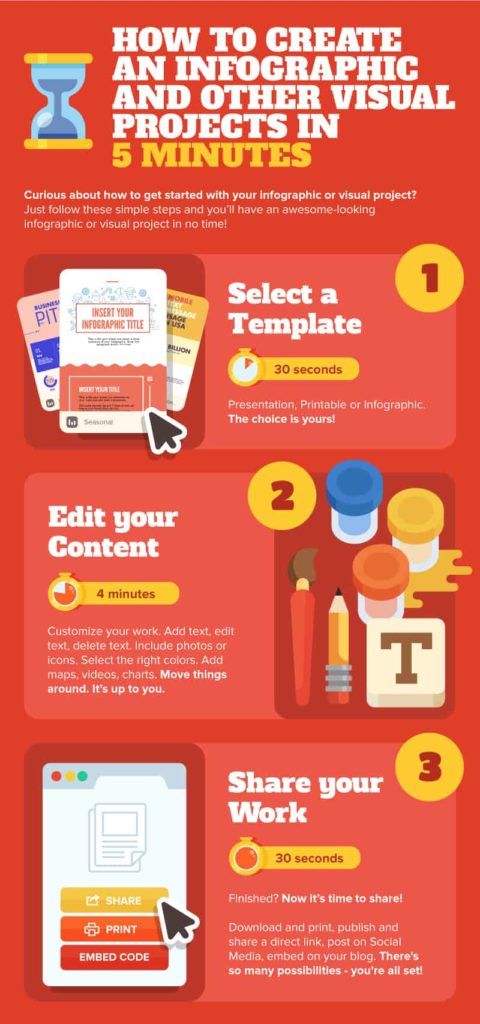
PiktoChart is one of the many excellent services that can help you create infographics and other visual content without design skills. Others that we’ve used and recommend include Canva and Venngage.
Charts
Nothing will help data tell a story like the right chart, and nothing will create a great chart fast like the right tool!
In our case, the right tool for the job is Google Charts or Tableau Public. Both are free, and both will turn your data into beautiful charts in minutes.
The best thing about these tools is that your charts don’t need to be static – they can be ‘live’ charts that you embed on your website and that automatically update when new data is entered. That can be a very powerful marketing tool!
Get Visual!
As you can see (pun intended), creating visual content doesn’t have to be hard, and it can create a massive boost in your marketing effectiveness. Use the tools above to get started making a more visual impact with your marketing content!